
Immigrants Have a Lower Incarceration Rate than Native-Born Americans
Even When Excluding Black Americans

Cato recently published my newest policy analysis, “Illegal Immigrant Incarceration Rates, 2010–2023," co-authored with Assistant Professor of Political Science at the University of Colorado Boulder Michelangelo Landgrave, who was also my former intern. This policy analysis is an updated version of earlier papers with newer data. Our consistent finding is that legal immigrants have the lowest incarceration rates, followed by illegal immigrants, and native-born Americans have the highest. Illegal immigrants are half as likely to be incarcerated as native-born Americans, and legal immigrants are 74 percent less likely to be incarcerated.
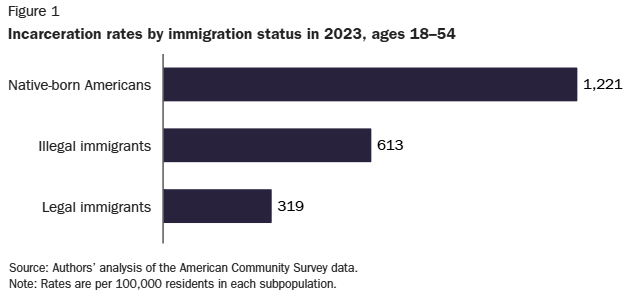
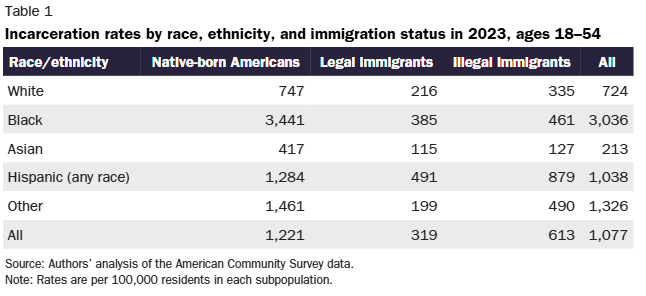
A persistent criticism of Cato’s paper in this series is that the native-born incarceration rate is only higher because black native-born Americans have such a high incarceration rate (see Table 1 from our paper). It’s certainly true that black native-born Americans have the highest incarceration rates of any ethnic or racial group in any immigrant category. However, the high black American incarceration rate does not overturn our results but merely narrows them. Immigrants have lower incarceration rates even without considering black native-born rates.
Excluding black native-born Americans and black immigrants reduces the native-born incarceration rate by 27 percent, from 1,221 to 891 per 100,000 in 2023 (see Table 1 for reference). Excluding black immigrants barely reduces the legal immigrant incarceration rate to 312 per 100,000 but increases the illegal immigrant incarceration rate to 626 per 100,000. Excluding blacks increases the illegal immigrant incarceration rates because their rate is below that of the rest of the population. The legal and illegal immigrant incarceration rate gap with natives also narrows to 65 percent and 30 percent lower, respectively. Excluding only black native-born Americans and keeping black immigrants in the sample, which doesn’t make sense but critics have brought it up, produces almost identical results.
It's worth pointing out that legal and illegal immigrants have lower incarceration rates than their ethnic and racial counterparts in the native-born population in every case. Furthermore, black legal or illegal immigrants do not have the highest incarceration rates. Immigrants don’t just have lower incarceration rates than native-born Americans because black Americans have such a high rate, but because immigrants of every racial and ethnic group have lower incarceration rates than their native-born ethnic and racial counterparts.
Hi Alex, I want to understand the paper and your data, but I have a bit of hard time. Can you help:
I could not find any source (other than Cato) confirming a 1221 per 100K incarcerated Americans, the estimates are rather around 580 per 100K (see: https://www.prisonpolicy.org/reports/pie2025.html)
And the population estimate that you can derive from the 613 per 100K for illegal immigrants would lead to about 24 million, accounting for percentage of male incarcerated and estimates for percentage of age between 18 & 54 and gender mix of male 54 vs female 46. If you ask your favorite AI for the highest estimate of illegals in 2023 a number below 14 million pops up. And using that number instead gives you 1015 per 100K.
I also want to ask why there is no discussion at all about the illegal immigrant population size in the study?
What am I missing here? Note that I have zero agenda, I am just trying to make sense of the numbers presented. And I can't, and I also can't find good backup data that matches the study.
Also the study does a breakdown by race that shows even using its own numbers that hispanics illegals (sources I found estimate 75% of illegal immigrants) have a higher rate than Whites or Asian Americans.). Isn't it alarming that 75% of illegals have the third highest incarceration rate even the studies numbers, let alone if the assumption of illegal population size is to high?
Here is the math:
Total illegal immigrants incarcerated in 2023: 67,813
Percentage of incarcerated illegal immigrants who are male: 93.9% (from Table 5)
Incarceration rate for illegal immigrants: 613 per 100,000
Calculating the total number of illegal male immigrants incarcerated:
67,813 × 0.939 = 63,676 illegal male immigrants incarcerated
To estimate the total population of illegal male immigrants:
If 63,676 represents 613 per 100,000 of the male illegal immigrant population, then:
63,676 ÷ (613 ÷ 100,000) = 10,387,600.
54% vs 46% male vs female assumption leads to 19.2 million, 80% in the age group of 18 to 54 leads to a total estimate of 24 million illegals in the USA.
If instead you assume 14 million illegals that would leave 6.27 million males and with 63K incarcerated a rate of 1,015 per 100K.